React Polar Uniform Heatmap Chart
Creates a React Polar Uniform Heatmap Chart using SciChart.js, with the following features: DataLabels, Rounded corners, Gradient-palette fill, startup animations.
drawExample.ts
index.tsx
theme.ts
generateHeatmapData.ts
1import {
2    PolarMouseWheelZoomModifier,
3    PolarZoomExtentsModifier,
4    PolarPanModifier,
5    PolarNumericAxis,
6    SciChartPolarSurface,
7    EPolarAxisMode,
8    NumberRange,
9    EAxisAlignment,
10    EPolarLabelMode,
11    HeatmapColorMap,
12    UniformHeatmapDataSeries,
13    PolarUniformHeatmapRenderableSeries,
14    HeatmapLegend,
15    Thickness,
16} from "scichart";
17import { appTheme } from "../../../theme";
18import { generateHeatmapData } from "./generateHeatmapData";
19
20const HEATMAP_WIDTH = 300;
21const HEATMAP_HEIGHT = 500;
22
23// Define color map globally to be used in both the chart and the legend
24const COLOR_MAP = new HeatmapColorMap({
25    minimum: 0,
26    maximum: 1,
27    gradientStops: [
28        { offset: 0, color: appTheme.VividPink },
29        { offset: 0.1, color: appTheme.VividOrange },
30        { offset: 0.2, color: appTheme.MutedRed },
31        { offset: 0.5, color: appTheme.VividGreen },
32        { offset: 0.8, color: appTheme.VividSkyBlue },
33        { offset: 0.9, color: appTheme.Indigo },
34        { offset: 1, color: appTheme.DarkIndigo },
35    ]
36})
37
38export const drawExample = async (rootElement: string | HTMLDivElement) => {
39    const { sciChartSurface, wasmContext } = await SciChartPolarSurface.create(rootElement, {
40        theme: appTheme.SciChartJsTheme,
41        padding: new Thickness(0, 60, 0, 0)
42    });
43
44    const radialAxisY = new PolarNumericAxis(wasmContext, {
45        polarAxisMode: EPolarAxisMode.Radial,
46        axisAlignment: EAxisAlignment.Right,
47        visibleRangeLimit: new NumberRange(0, HEATMAP_HEIGHT),
48        useNativeText: true,
49        drawMinorGridLines: false,
50
51        drawMajorTickLines: false,
52        drawMinorTickLines: false,
53        labelPrecision: 0,
54        innerRadius: 0.2
55    });
56    sciChartSurface.yAxes.add(radialAxisY);
57
58    const angularAxisX = new PolarNumericAxis(wasmContext, {
59        polarAxisMode: EPolarAxisMode.Angular,
60        axisAlignment: EAxisAlignment.Top,
61        flippedCoordinates: true,
62        useNativeText: true,
63
64        drawMajorTickLines: false,
65        drawMinorTickLines: false,
66        polarLabelMode: EPolarLabelMode.Parallel,
67        labelPrecision: 0,
68        totalAngle: Math.PI / 2
69    });
70    sciChartSurface.xAxes.add(angularAxisX);
71
72    const heatmapSeries = new PolarUniformHeatmapRenderableSeries(wasmContext, {
73        dataSeries: new UniformHeatmapDataSeries(wasmContext, {
74            zValues: generateHeatmapData(HEATMAP_WIDTH, HEATMAP_HEIGHT, 1999),
75            xStart: 0,
76            xStep: 1,
77            yStart: 0,
78            yStep: 1,
79        }),
80        colorMap: COLOR_MAP,
81        stroke: "white",
82        strokeThickness: 5,
83    });
84    sciChartSurface.renderableSeries.add(heatmapSeries);
85
86    sciChartSurface.chartModifiers.add(
87        new PolarPanModifier(),
88        new PolarZoomExtentsModifier(),
89        new PolarMouseWheelZoomModifier()
90    );
91
92    return { sciChartSurface, wasmContext };
93};
94
95// Draws a Heatmap legend over the <div id={divHeatmapLegend}></div>
96export const drawHeatmapLegend = async (rootElement: string | HTMLDivElement) => {
97    const { heatmapLegend } = await HeatmapLegend.create(rootElement, {
98        theme: {
99            ...appTheme.SciChartJsTheme,
100            sciChartBackground: appTheme.DarkIndigo + "BB",
101            loadingAnimationBackground: appTheme.DarkIndigo + "BB",
102        },
103        yAxisOptions: {
104            isInnerAxis: true,
105            labelStyle: {
106                fontSize: 14,
107                color: appTheme.ForegroundColor,
108            },
109            axisBorder: {
110                borderRight: 2,
111                color: appTheme.ForegroundColor,
112            },
113            majorTickLineStyle: {
114                color: appTheme.ForegroundColor,
115                tickSize: 8,
116                strokeThickness: 2,
117            },
118            minorTickLineStyle: {
119                color: appTheme.ForegroundColor,
120                tickSize: 4,
121                strokeThickness: 1,
122            },
123        },
124        colorMap: COLOR_MAP
125    });
126
127    return { sciChartSurface: heatmapLegend.innerSciChartSurface.sciChartSurface };
128};
See Also: Polar Charts (20 Demos)
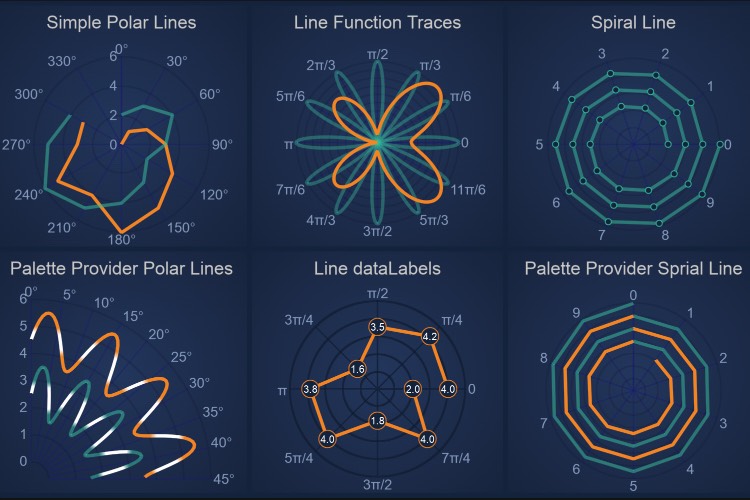
React Polar Line Chart
React Polar Line Chart demo by SciChart supports gradient fill and paletteproviders for more custom coloring options. Get your free demo now.
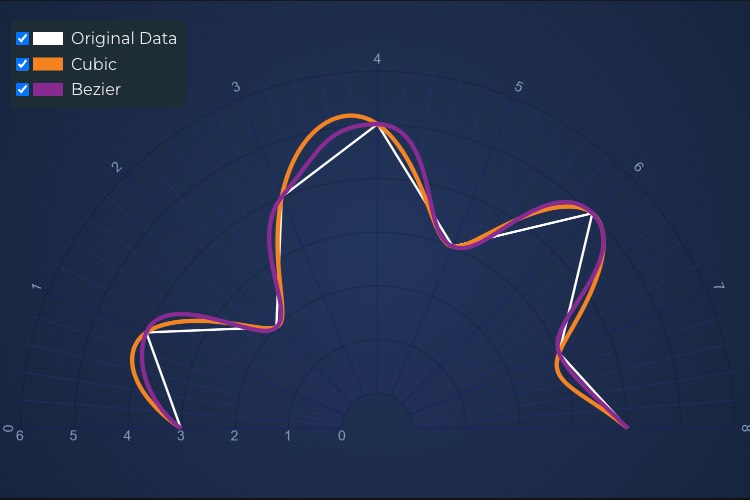
React Polar Spline Line Chart
React Polar Spline Line Chart demo by SciChart supports gradient fill and paletteproviders for more custom coloring options. Get your free demo now.
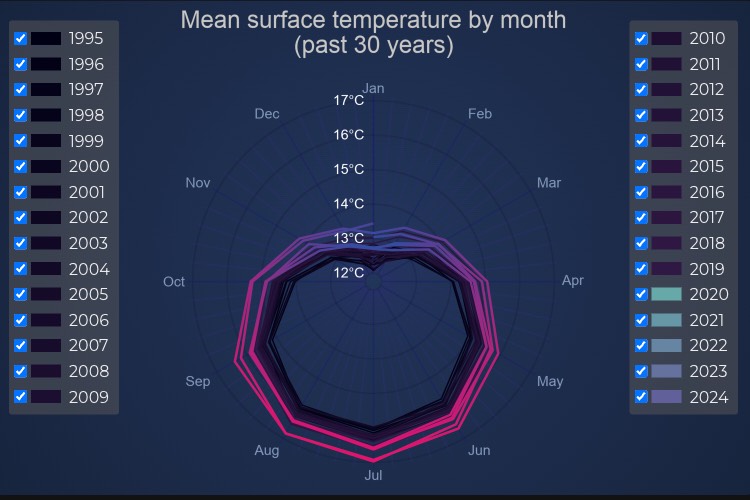
React Polar Line Temperature Average
React Polar Line Temperature Average demo by SciChart supports gradient fill and paletteproviders for more custom coloring options. Get your free demo now.

React Polar Column Chart
React Polar Column Chart demo by SciChart supports gradient fill and paletteproviders for more custom coloring options. Get your free demo now.
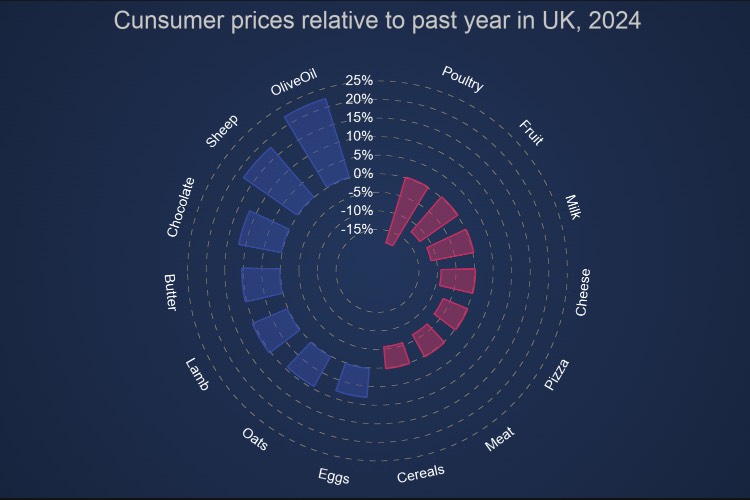
React Polar Column Category Chart
React Polar Column Category Chart demo by SciChart supports gradient fill and paletteproviders for more custom coloring options. Get your free demo now.
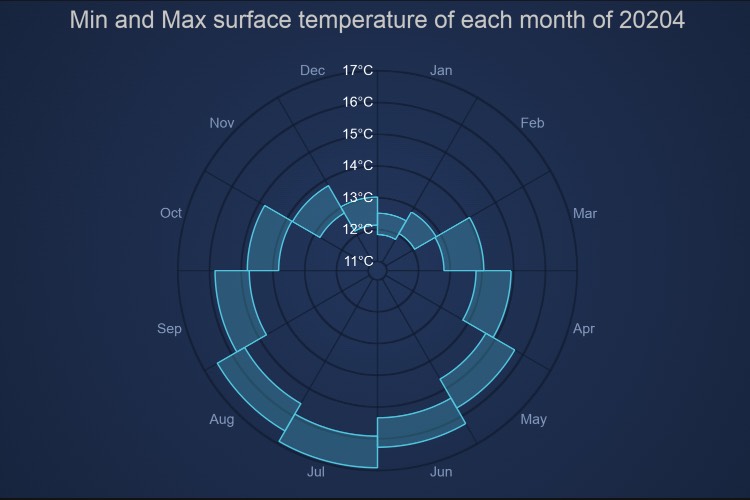
React Polar Range Column Chart
React Polar Range Column Chart demo by SciChart supports gradient fill and paletteproviders for more custom coloring options. Get your free demo now.
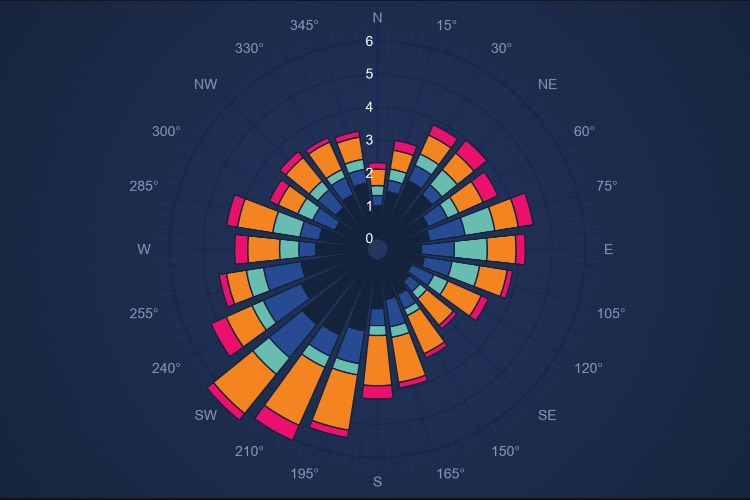
React Windrose Column Chart
React Windrose Column Chart demo by SciChart supports gradient fill and paletteproviders for more custom coloring options. Get your free demo now.
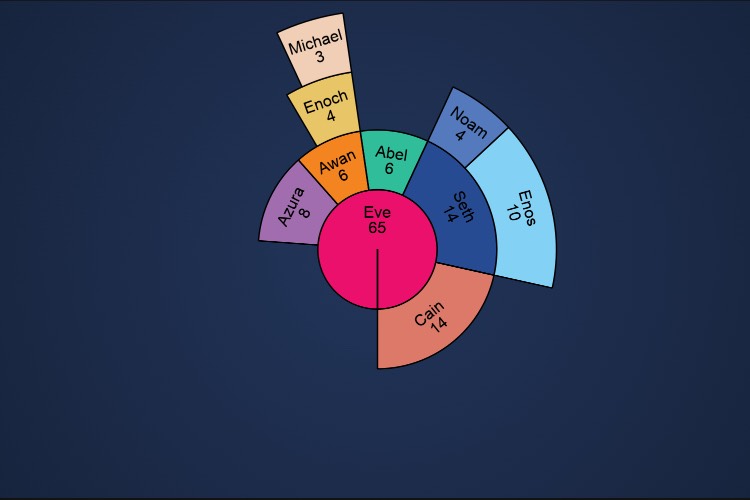
React Polar Sunburst Chart
React Polar Sunburst Chart demo by SciChart supports gradient fill and paletteproviders for more custom coloring options. Get your free demo now.
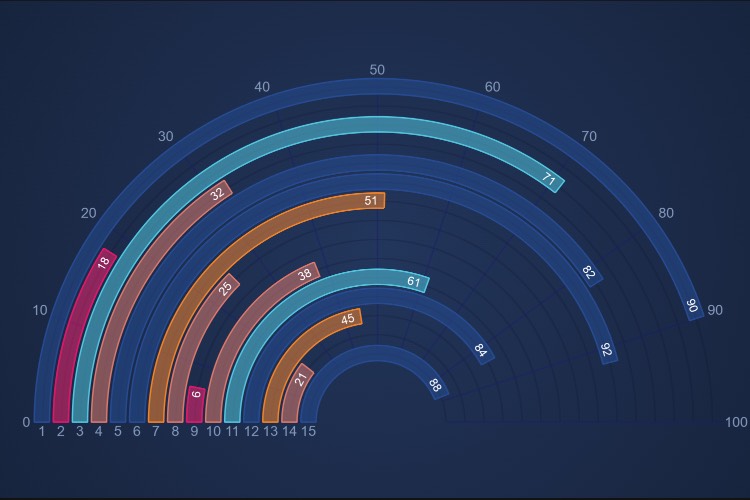
React Radial Column Chart
React Radial Column Chart demo by SciChart supports gradient fill and paletteproviders for more custom coloring options. Get your free demo now.
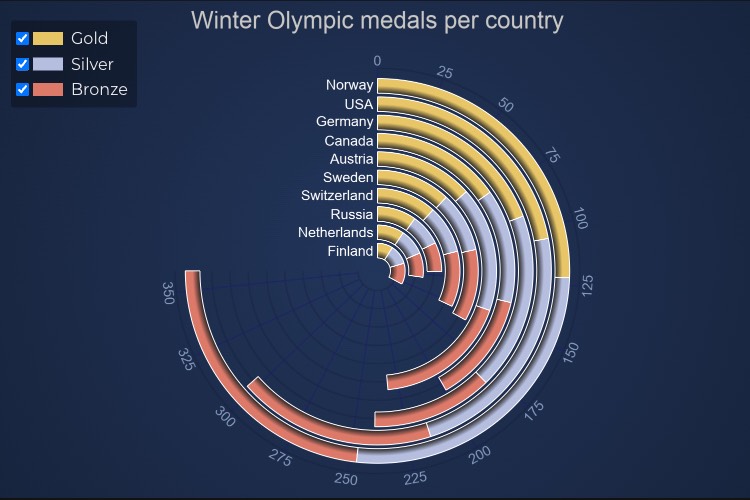
React Stacked Radial Column Chart
React Stacked Radial Column Chart demo by SciChart supports gradient fill and paletteproviders for more custom coloring options. Get your free demo now.
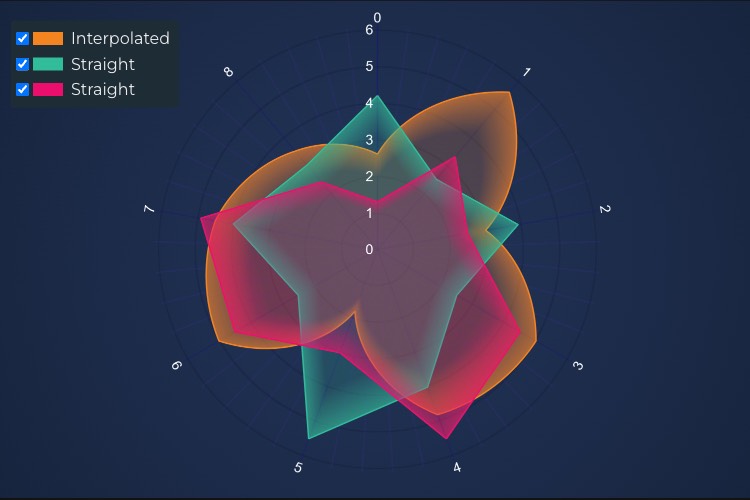
React Polar Mountain Chart
React Polar Mountain Chart demo by SciChart supports gradient fill and paletteproviders for more custom coloring options. Get your free demo now.
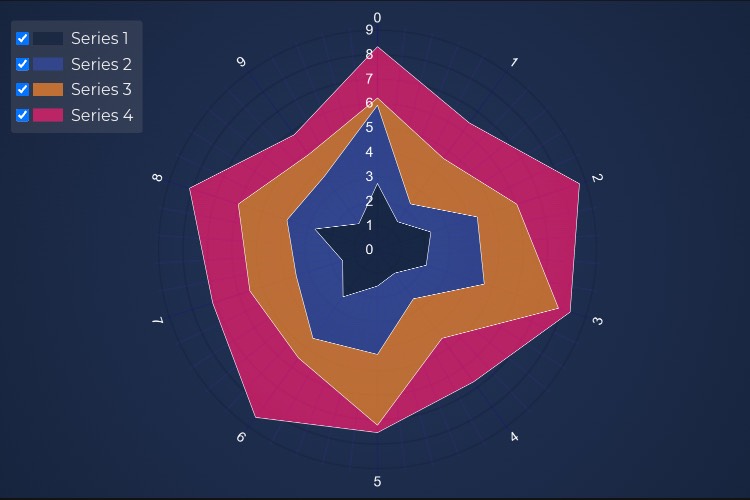
React Polar Stacked Mountain Chart
React Polar Stacked Mountain Chart demo by SciChart supports gradient fill and paletteproviders for more custom coloring options. Get your free demo now.
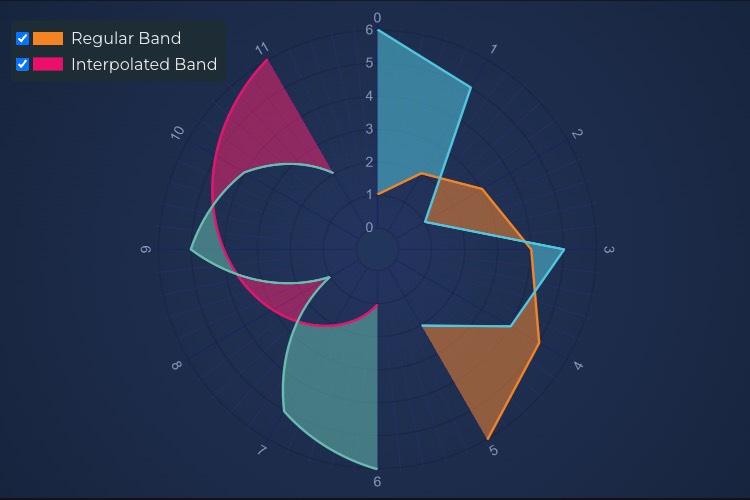
React Polar Band Chart
React Polar Band Chart demo by SciChart supports gradient fill and paletteproviders for more custom coloring options. Get your free demo now.
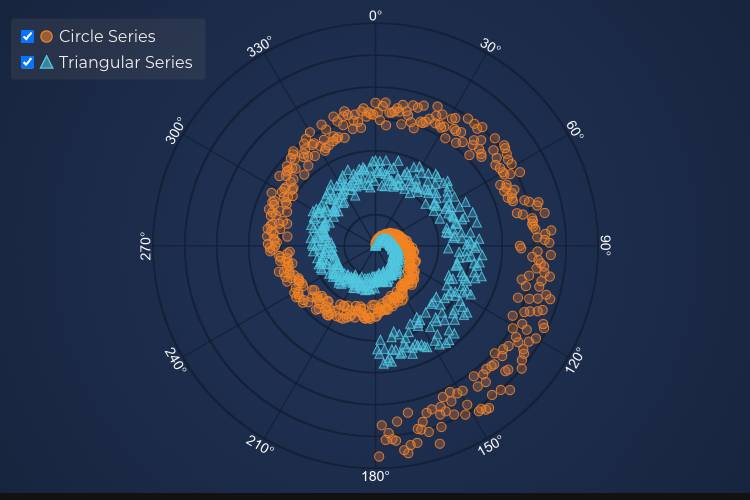
React Polar Scatter Chart
React Polar Scatter Chart demo by SciChart supports gradient fill and paletteproviders for more custom coloring options. Get your free demo now.
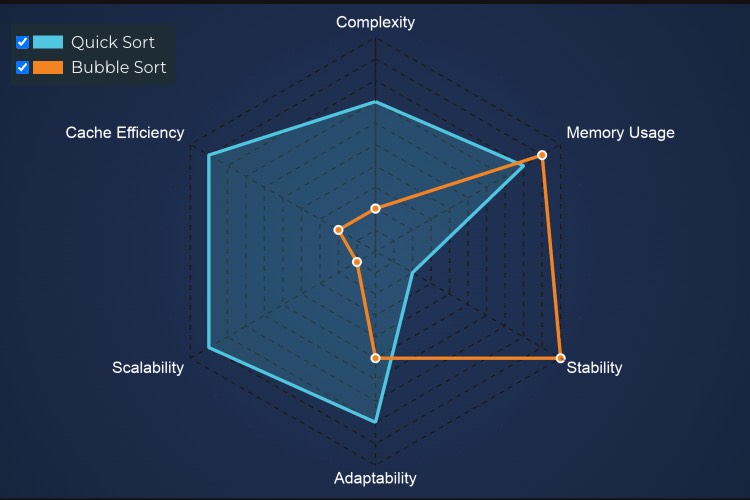
React Polar Radar Chart
React Polar Radar Chart demo by SciChart supports gradient fill and paletteproviders for more custom coloring options. Get your free demo now.
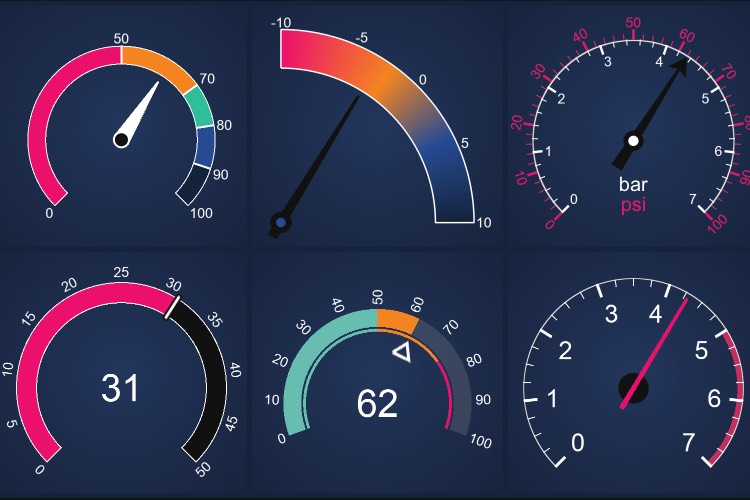
React Polar Gauge Chart
React Polar Gauge Chart demo by SciChart supports gradient fill and paletteproviders for more custom coloring options. Get your free demo now.
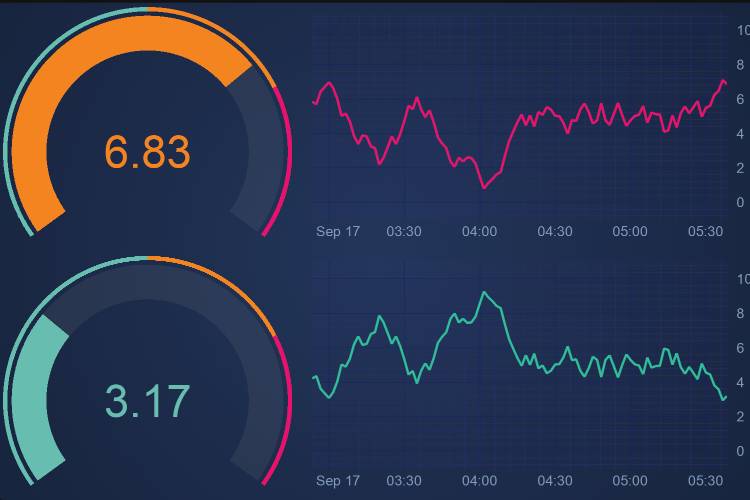
React Polar Gauge Fifo Dashboard
React Polar Gauge Fifo Dashboard demo by SciChart supports gradient fill and paletteproviders for more custom coloring options. Get your free demo now.

React Polar Ultrasound Heatmap
React Polar Ultrasound Heatmap demo by SciChart supports gradient fill and paletteproviders for more custom coloring options. Get your free demo now.
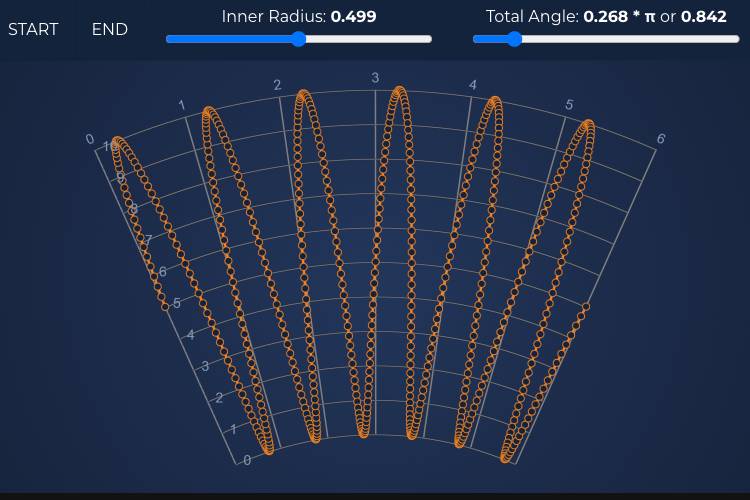
React Polar Partial Arc
React Polar Partial Arc demo by SciChart supports gradient fill and paletteproviders for more custom coloring options. Get your free demo now.
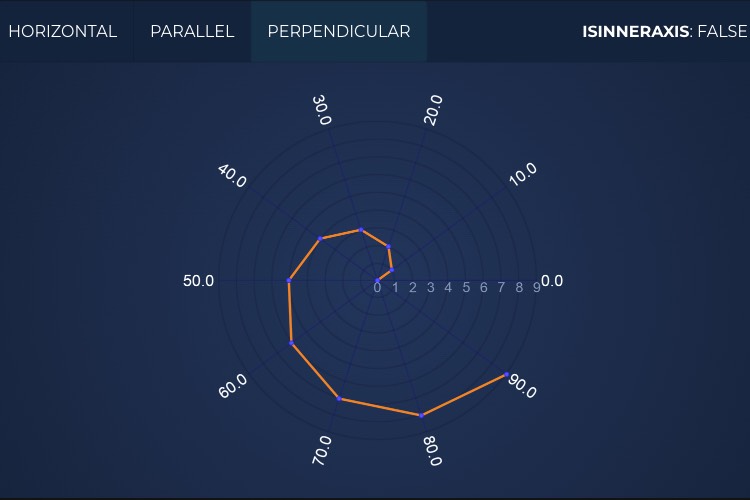
React Polar Label Modes
React Polar Label Modes demo by SciChart supports gradient fill and paletteproviders for more custom coloring options. Get your free demo now.